Having way too much fun with this project.
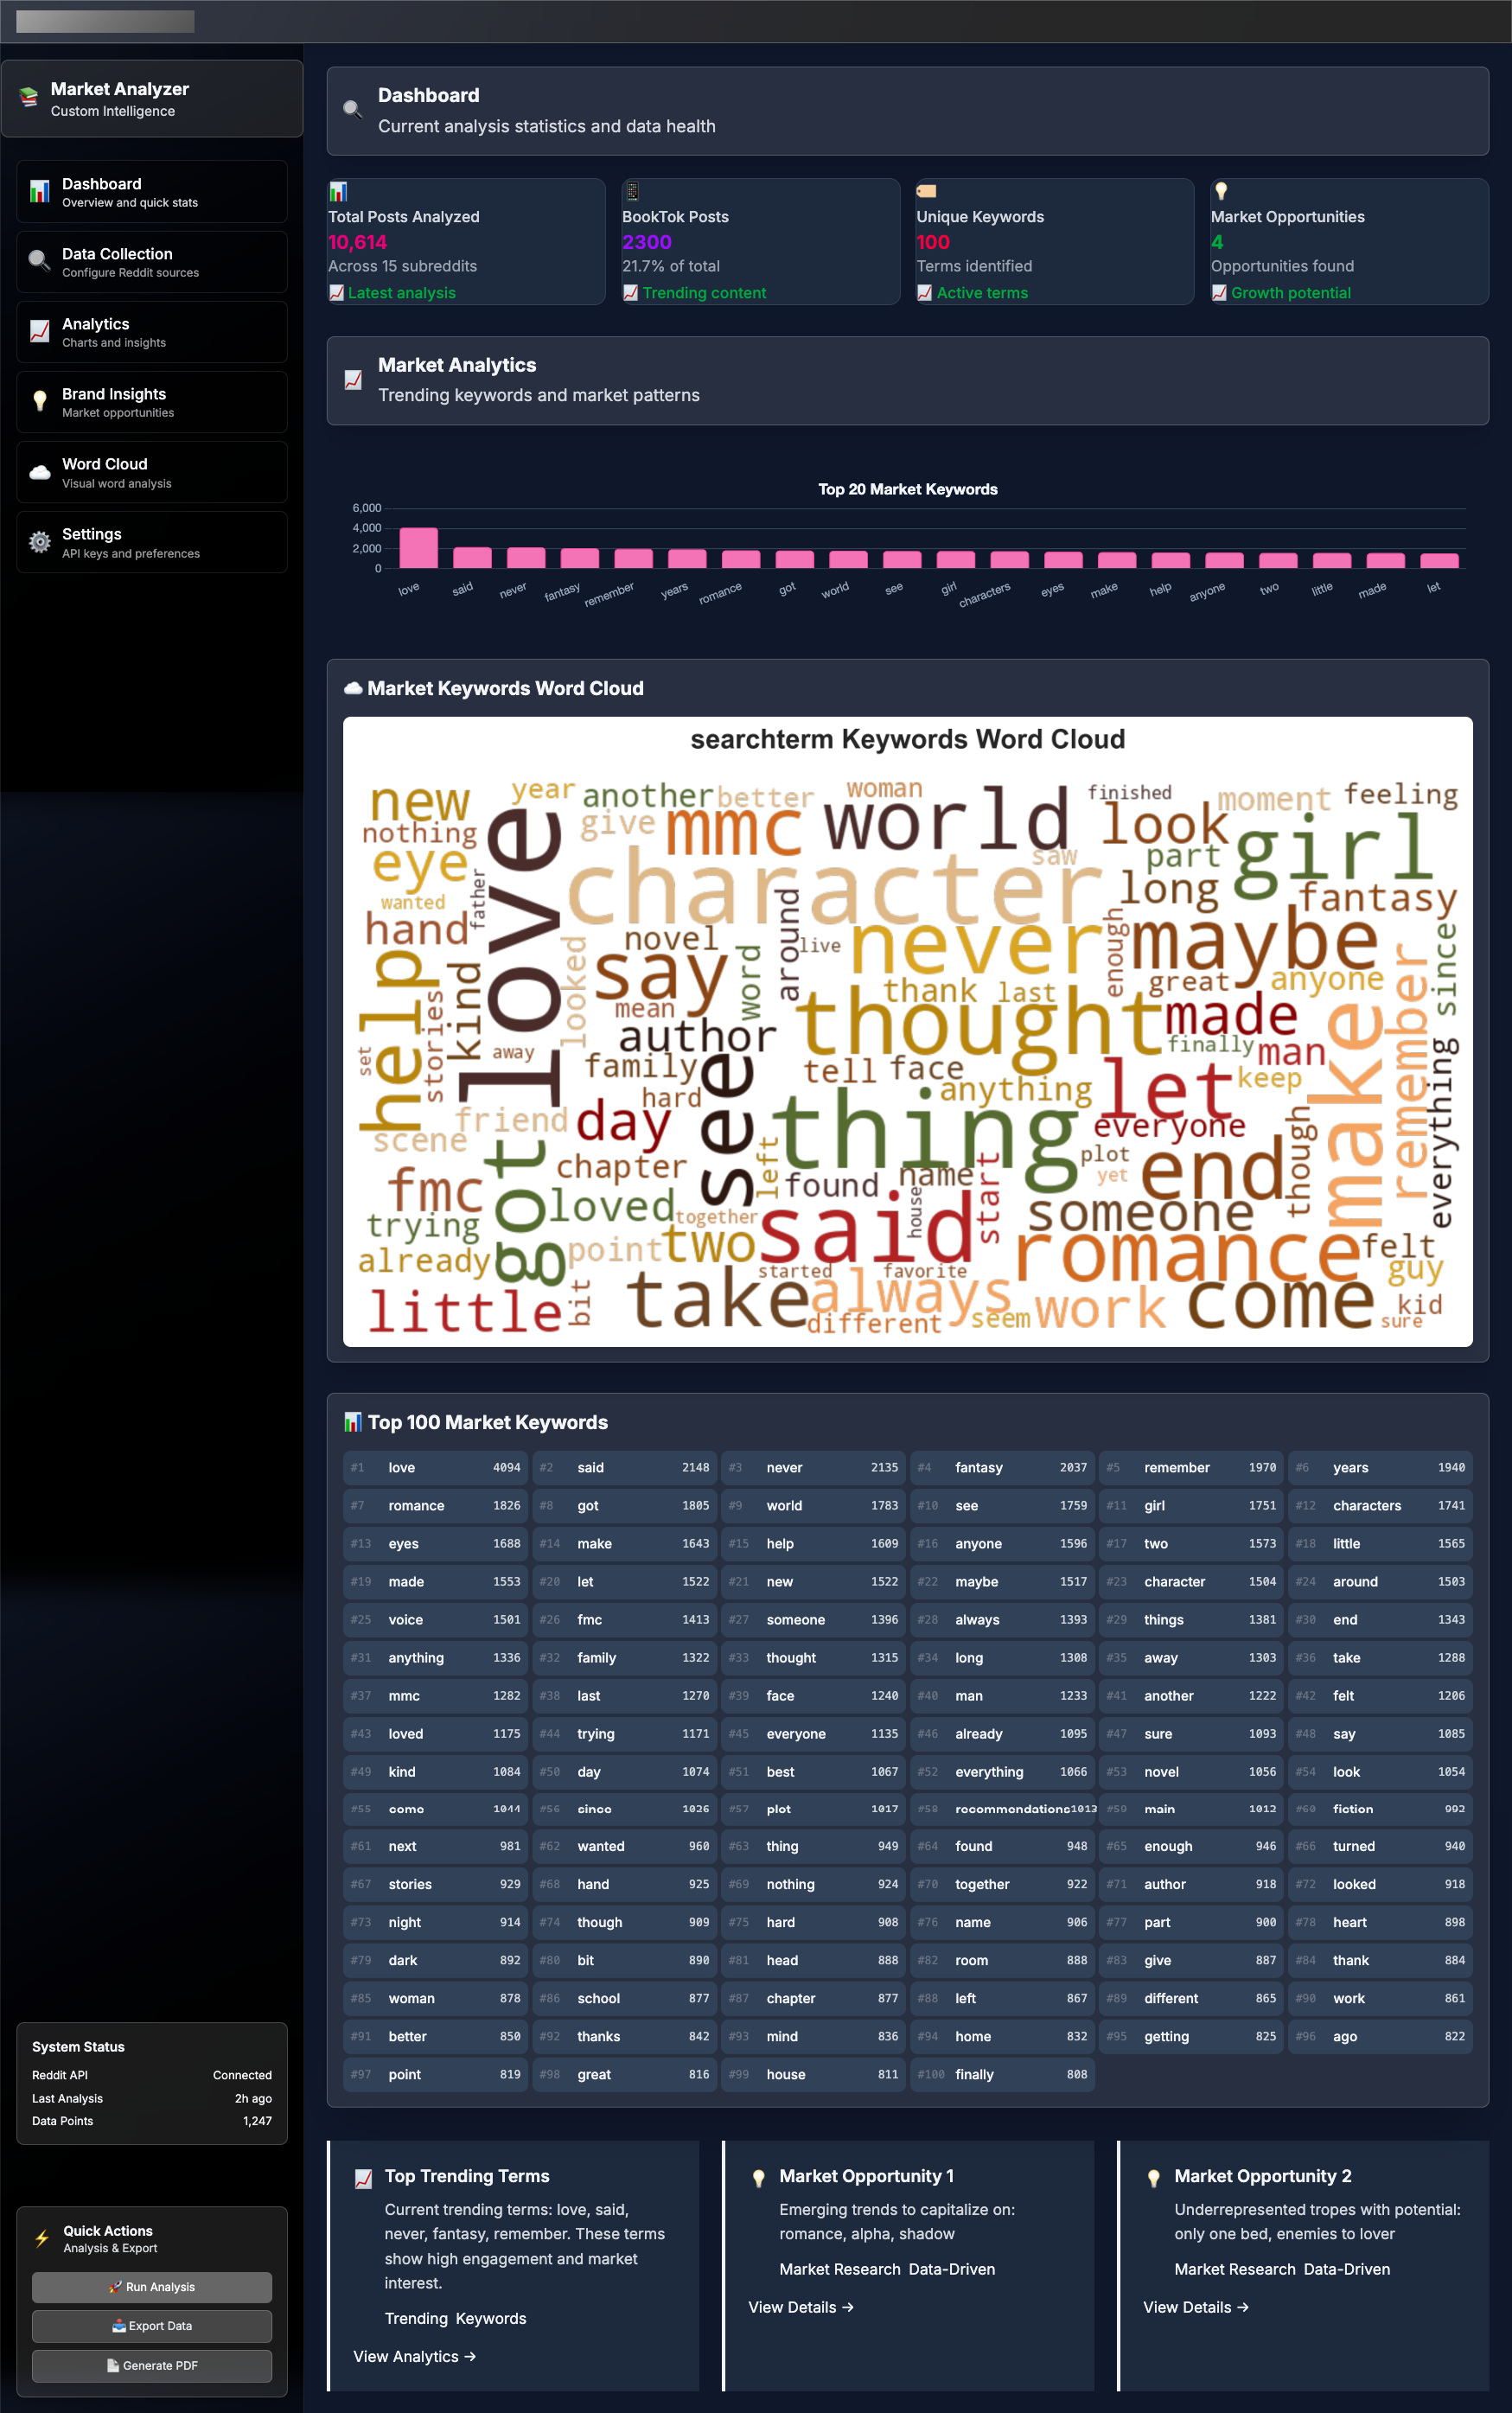
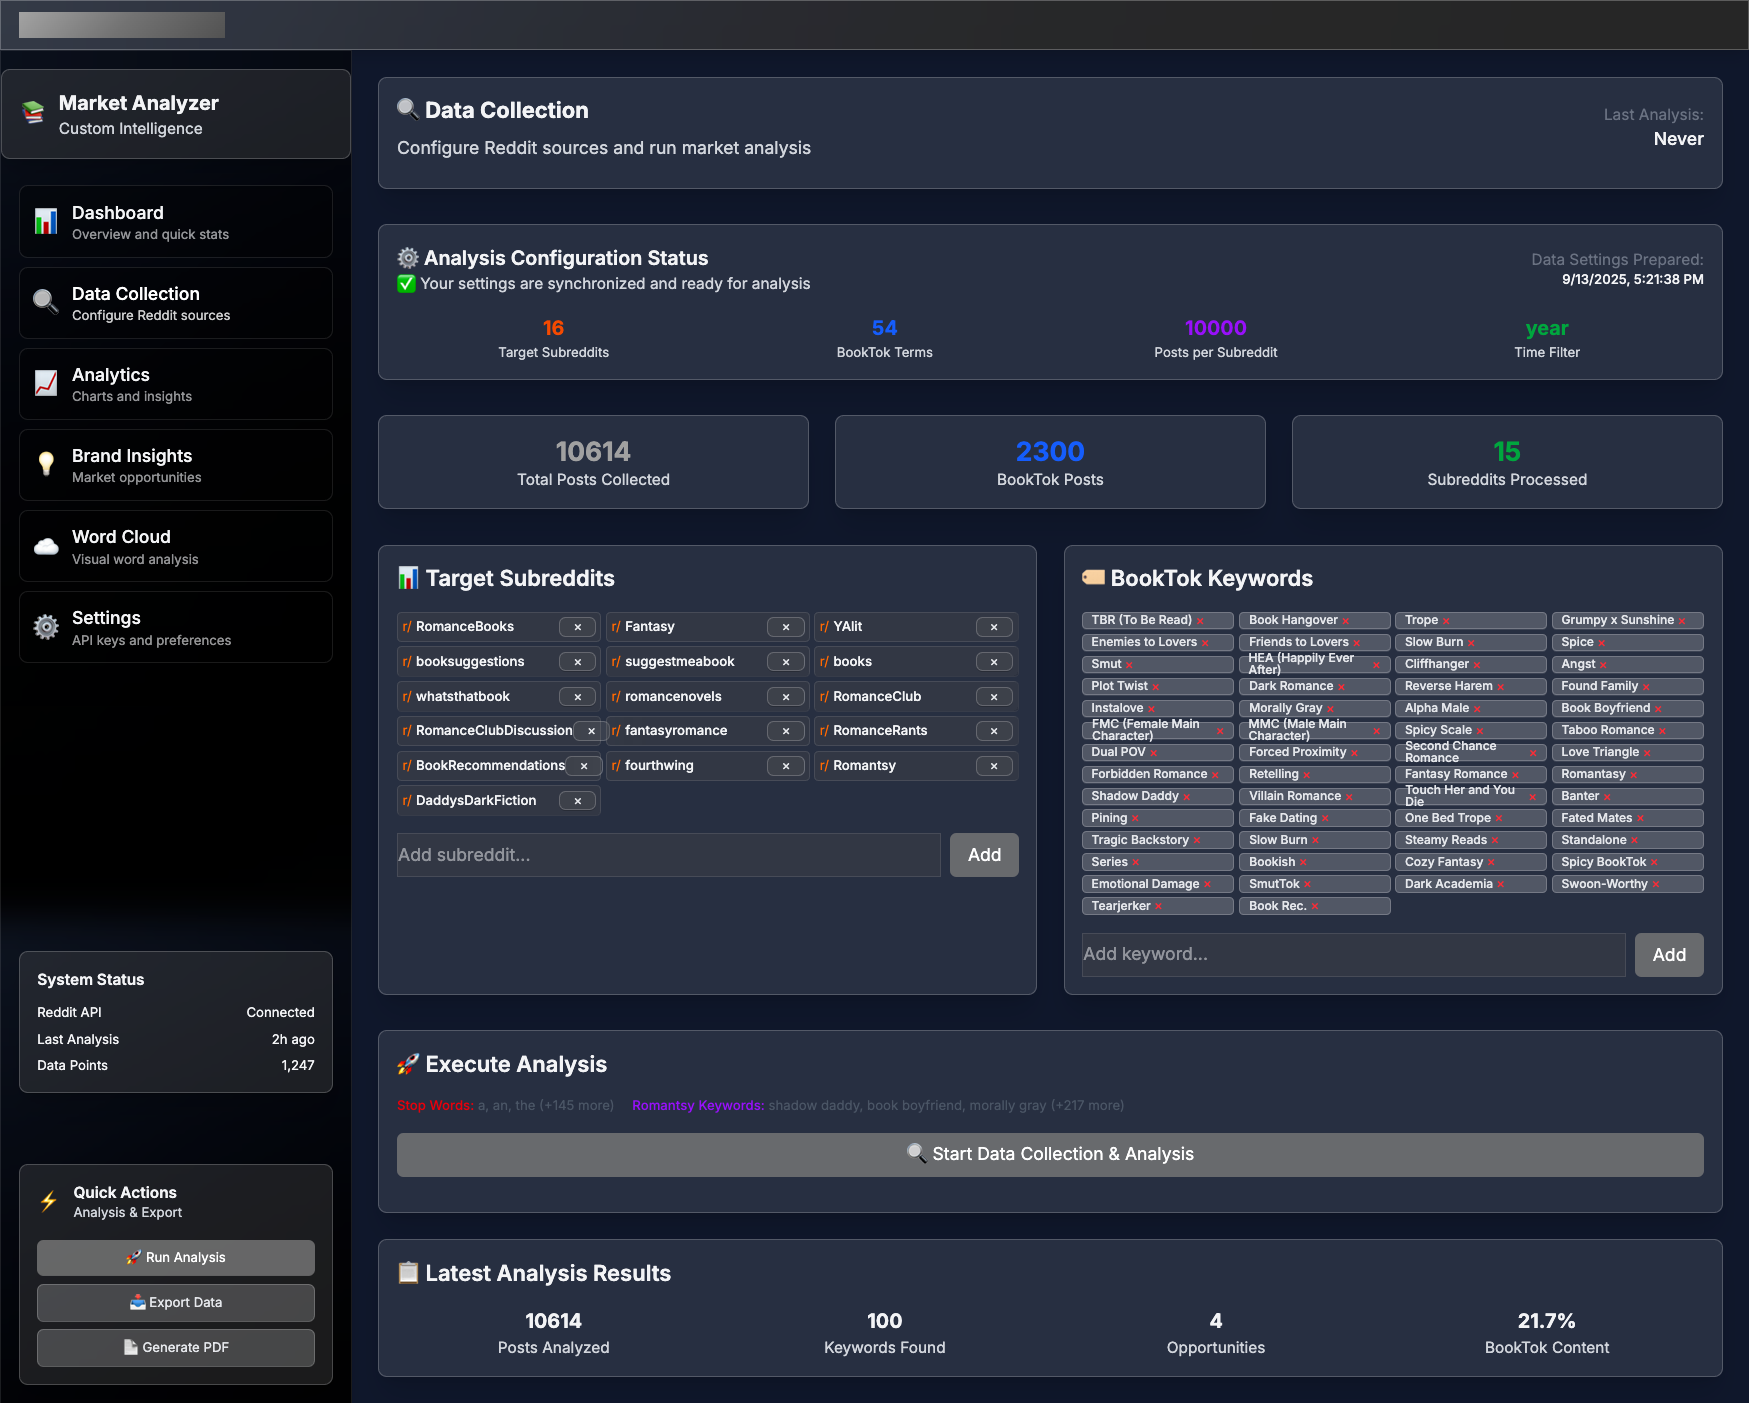
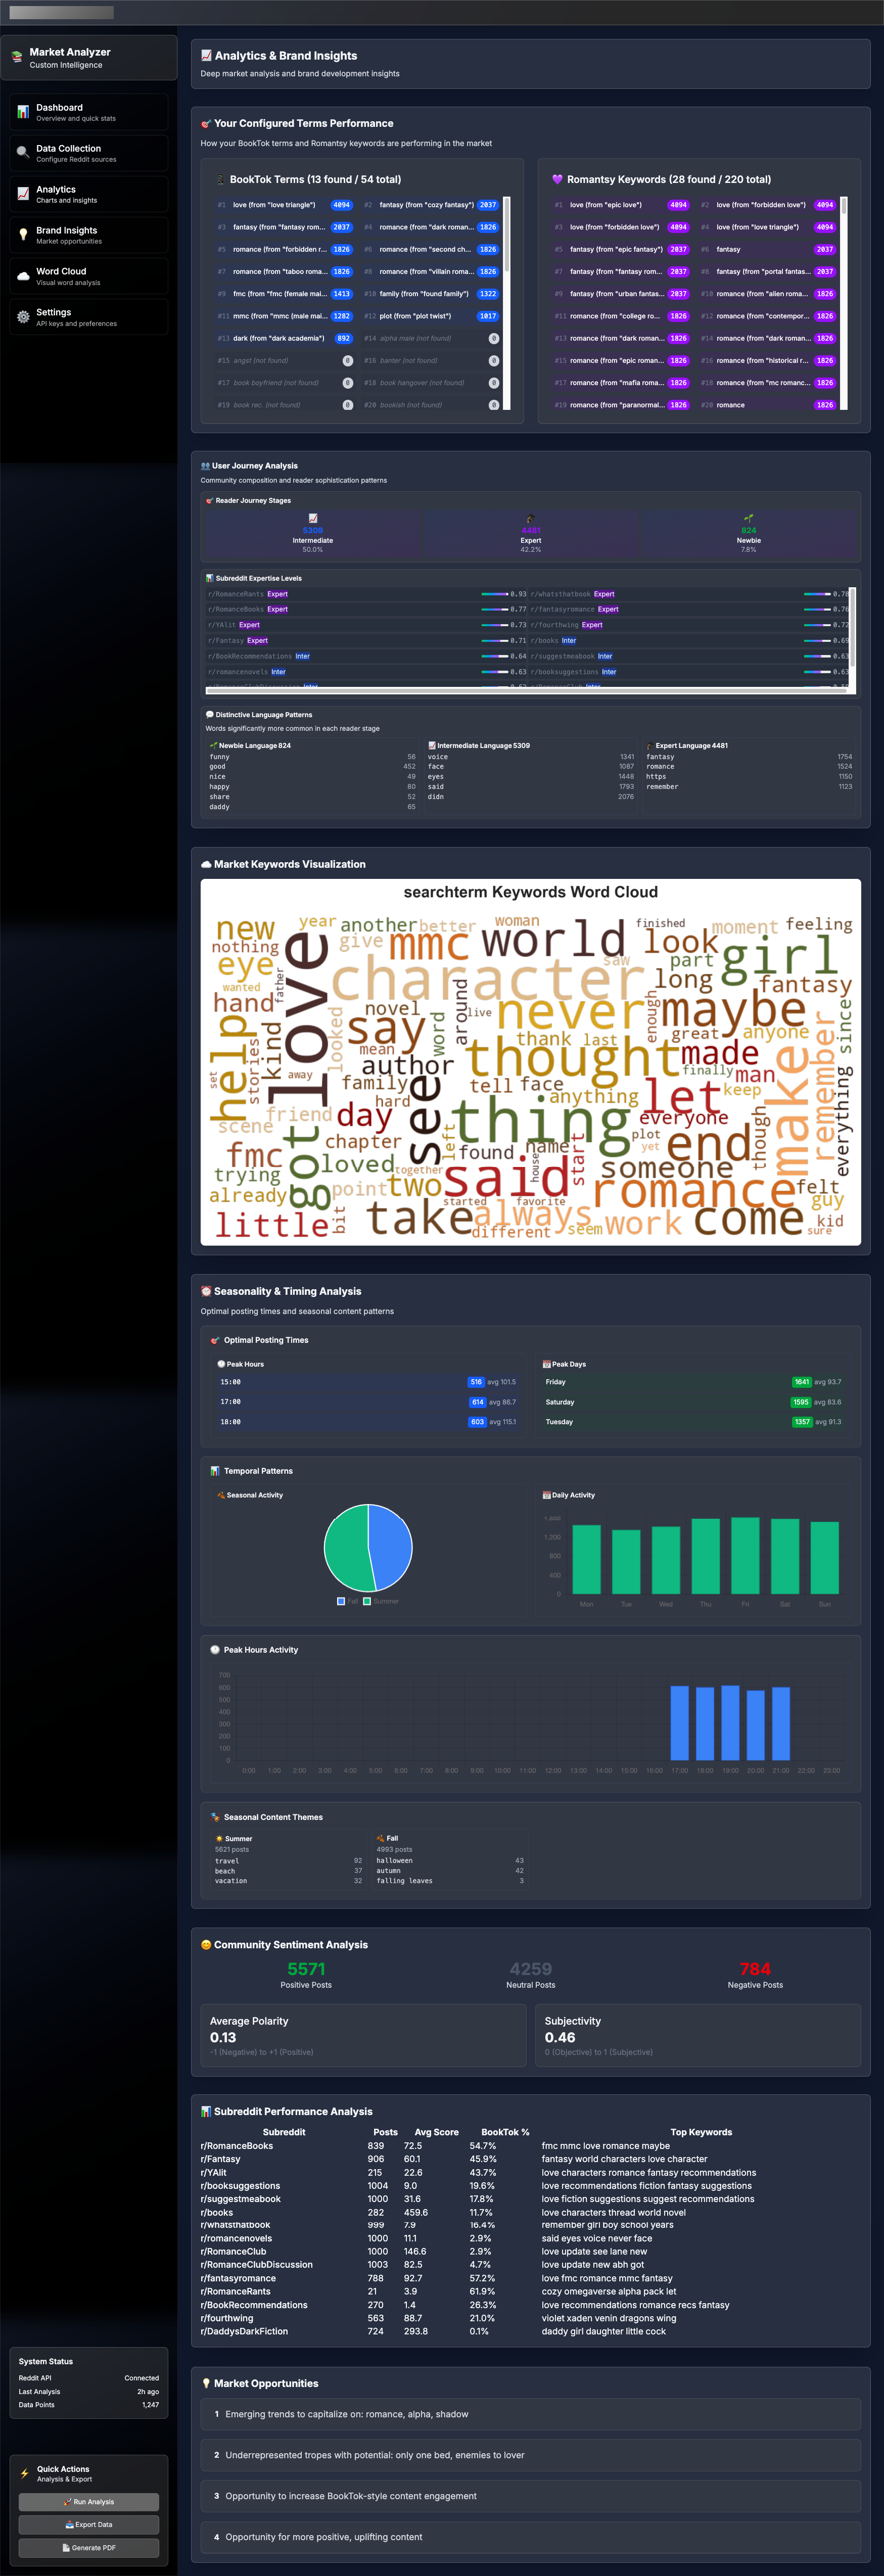
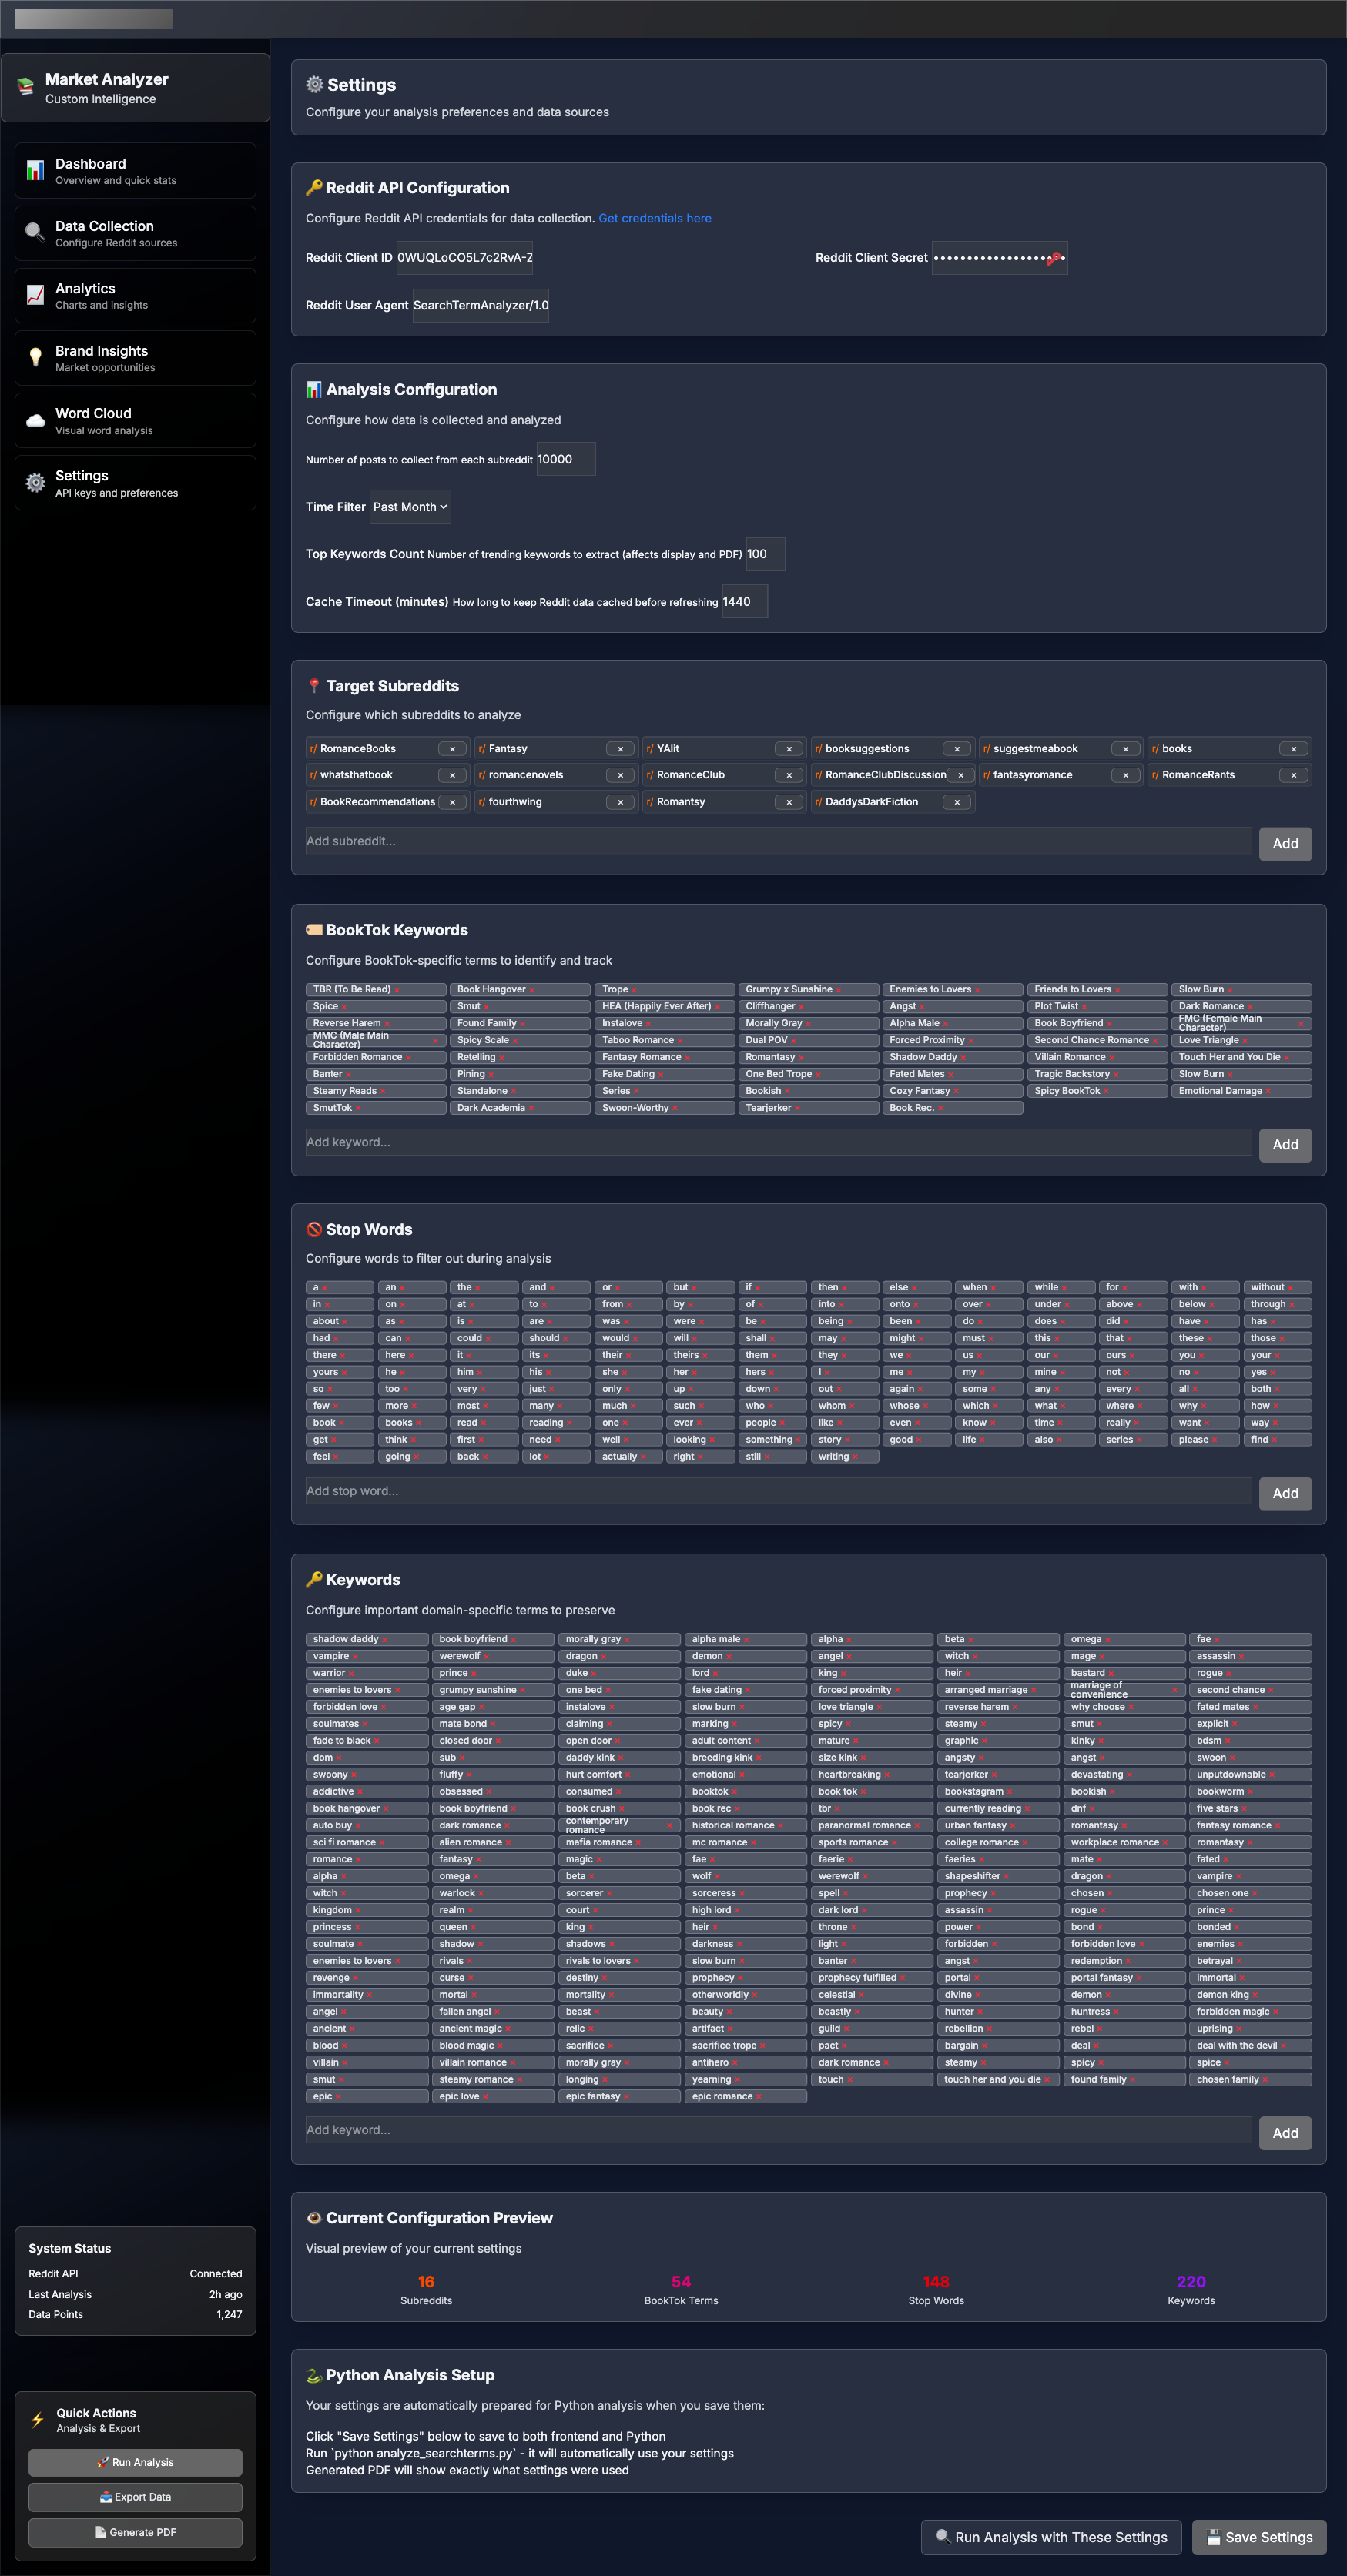
Screenshots of the web tool:
I added a user journey pattern analysis and a seasonal trend analysis.
User Journey Analysis
1. Language Sophistication Scoring
- Newbie indicator detection: Help-seeking patterns, basic descriptors, genre confusion
- Expert indicator identification: Advanced tropes, character analysis, industry knowledge
- Community abbreviation recognition: MMC, FMC, HEA, DNF, TBR, etc.
- Engagement sophistication analysis: Simple ratings vs detailed reviews
2. Journey Stage Classification
- Sophistication scoring (0-1 scale): Expert vs newbie language ratio
- Three-stage classification: Newbie (0-0.3), Intermediate (0.3-0.7), Expert (0.7-1.0)
- Dynamic stage assignment based on vocabulary patterns
3. Community Intelligence Analysis
- Temporal evolution tracking: How sophistication changes over time
- Subreddit expertise mapping: Beginner-friendly vs expert communities
- Engagement pattern analysis: Correlation between expertise and community response
- Vocabulary evolution by stage: Unique terminology for each reader level
4. Market Strategy Insights
- Community composition analysis: Percentage breakdown of reader stages
- Content targeting recommendations: Beginner guides vs expert discussions
- Platform positioning strategy: Where to focus different types of content
- Expert vocabulary opportunity identification: Terms for advanced marketing
How It Works
User Journey Analysis
Method: Language sophistication scoring to classify readers from newbie → expert
- Language Pattern Detection
Newbie indicators
- Help-seeking: “help me find”, “need recommendations”, “where do I start”
- Basic descriptors: “good”, “bad”, “nice”, “cute”
- Genre confusion: “romance or fantasy?”, “what genre is this?”
- Simple engagement: “4/5 stars”, “liked it”
Expert indicators
- Advanced tropes: “enemies to lovers”, “grumpy sunshine”, “forced proximity”
- Character analysis: “morally gray”, “redemption arc”, “dual POV”
- Industry knowledge: “trigger warning”, “steam level”, “indie author”, “ARC”
- Community abbreviations: “MMC”, “FMC”, “HEA”, “DNF”, “TBR”
- Sophistication Scoring
- Counts expert vs newbie language patterns in each post
- Calculates sophistication score: 0-1 scale (0=newbie, 1=expert)
- Classifies users: Newbie (0-0.3), Intermediate (0.3-0.7), Expert (0.7-1.0)
- Community Analysis
- Stage Distribution: % breakdown of reader levels
- Subreddit Expertise: Which communities are beginner-friendly vs expert
- Vocabulary Evolution: Different terminology by reader stage
Seasonality Analysis
Method: Temporal pattern analysis using datetime data from posts
-
Time Component Extraction df[‘hour’] = df[‘created_datetime’].dt.hour # 0-23 df[‘day_of_week’] = df[‘created_datetime’].dt.day_name() # Monday-Sunday df[‘month’] = df[‘created_datetime’].dt.month # 1-12 df[‘season’] = df[‘month’].apply(get_season) # winter/spring/summer/fall df[‘is_weekend’] = df[‘day_of_week_num’].isin([5,6]) # Sat/Sun
-
Pattern Analysis
- Optimal Posting Times: When posts get most engagement (post count × avg score)
- Temporal Patterns: Hourly, daily, monthly, seasonal activity
- Weekend vs Weekday: Different engagement patterns
- Seasonal Content: Romance themes by season (cozy winter, beach summer, etc.)
- Engagement Timing
- Peak Hours: Best times to post for maximum visibility
- Peak Days: Most active days of the week
- Seasonal Trends: When different romance themes perform best
Charting for PDF
- Server-side chart generation using a headless browser to capture the charts as images
- Chart.js with node-canvas to generate charts on the server
- Puppeteer screenshot of the chart elements
Data Flow for User Journey Analysis
- Data Collection (/data directory)
- analyze_searchterms.py runs the main analysis
- Calls self.journey_analyzer.analyze_user_journey_patterns(df) (line 188)
- Stores results in analysis_results[‘user_journey_analysis’]
- Data Persistence
-
Results saved to /data/analysis_results_YYYYMMDD_HHMMSS.json
-
Contains text_analysis.user_journey_analysis with:
-
stage_distribution (newbie/intermediate/expert counts)
-
average_sophistication_by_subreddit
-
vocabulary_evolution (top words by stage)
-
engagement_by_journey_stage
- Frontend Display
- Analytics page reads from /api/analysis/latest
- Extracts userJourneyData = data.text_analysis?.user_journey_analysis
- Shows reader stages, subreddit expertise, vocabulary evolution
- PDF Generation
- PDF generator reads same /data/analysis_results_*.json files
- Accesses data.text_analysis?.user_journey_analysis
- Renders journey analysis section with stage breakdowns and charts
- Integration Points - can be easily replaced by API/DB for scalability
- Python analysis writes to /data/analysis_results_*.json
- Frontend analytics page displays the data
- PDF generator includes the same data
- All use identical data structure for consistency
Improved Vocabulary Analysis Approach
Here’s what I changed in the vocabulary analysis:
Enhanced Filtering
- Comprehensive stop words: Removed common words like “the”, “and”, “book”, “read”, “really”, “very”, etc.
- Minimum word length: 4+ characters to avoid noise
- Minimum frequency: Words must appear at least 5 times to be considered
- Generic term removal: Filtered out words like “book”, “books”, “reading”, “reader”
Distinctive Word Detection
Instead of showing the most common words in each category, I now calculate distinctiveness:
- Relative frequency calculation: How often a word appears in each stage relative to total words in that stage
- Cross-stage comparison: Compare usage frequency across newbie/intermediate/expert posts
- Distinctiveness ratio: Only show words that are at least 2x more common in one stage vs others
- Ranking by distinctiveness: Words that are unique to or heavily skewed toward one stage appear first
What This Should Show
- Newbie distinctive words: Words like “help”, “suggestions”, “beginner”, “start”, “confused”
- Expert distinctive words: Terms like “tropes”, “enemies”, “morally”, “redemption”, “pacing”, “worldbuilding”
- Intermediate distinctive words: Mix of both, or transitional language
Questions for Discussion:
- Minimum thresholds: Currently requiring 5+ occurrences and 2x more common - should these be higher/lower?
- Word filtering: Should I add more domain-specific stop words (like “story”, “author”, “character”)?
- Analysis scope: Should I also look for:
- Specific romance terminology (MMC, FMC, HEA, etc.)
- Emotional language patterns (swoon, angst, steam)
- Question vs statement patterns (newbies ask more questions) 4. Display approach: Currently showing top 8 distinctive words per stage
Conclusion
DOES THIS NOT LOOK LIKE REGULAR LOGIC CODE?!?! Yes, Pandas and dataframes let us manipulate the data more easily, alike any other data structure or utility libraries!!!